
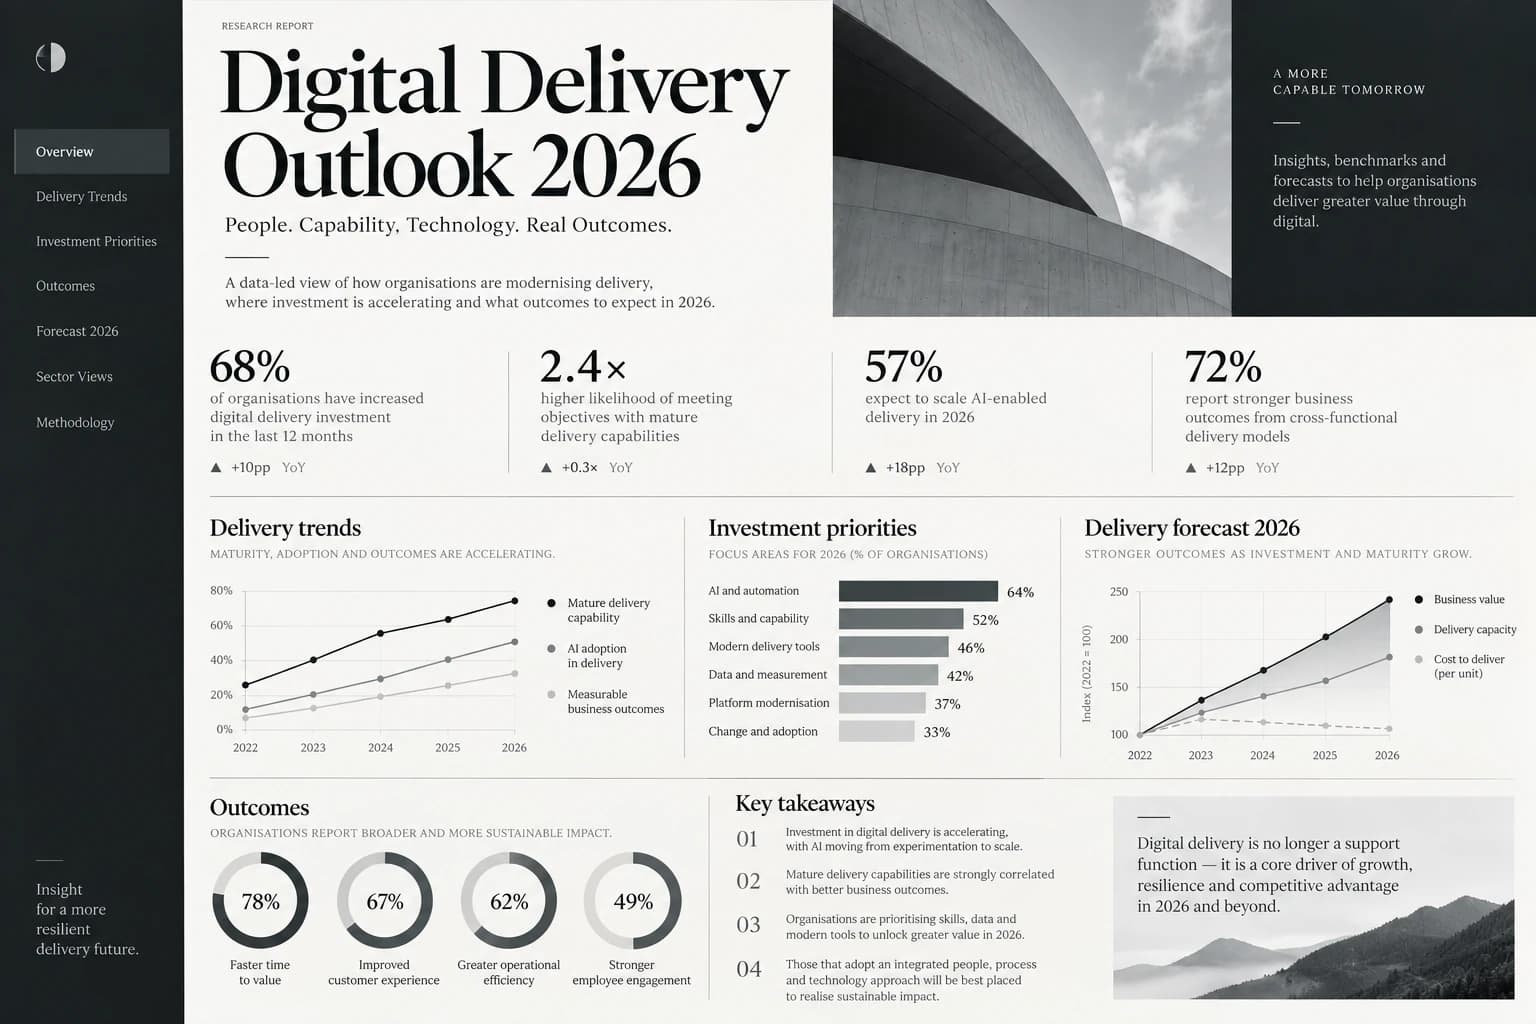
Digital delivery priorities for 2026: an agency outlook
ABT's 2026 digital delivery outlook covers accountable product ownership, controlled AI pilots, resilient platforms, and a practical planning exercise.
All articles ↗Assess product discovery, product pages, cart, checkout, and post-purchase service with a repeatable ecommerce UX scorecard.

This assessment framework helps a commerce team evaluate its own customer journey. It is a scorecard for internal improvement, not a claim that stores have been ranked against an external dataset.
Review product discovery, product detail, cart, checkout, and post-purchase support. For each, test on a phone and desktop with realistic stock, delivery, and payment conditions. Score each journey from 0 to 3: 0 means it cannot be completed, 1 means major friction, 2 means usable with clear issues, and 3 means reliable and understandable. Record evidence beside every score.
Review search terms with no results, cart exits, payment failures, support contacts, returns, and fulfillment exceptions. Segment by device and market where the volume supports a meaningful comparison. Avoid treating every exit as a design failure; some customers are researching or comparing.
Prioritize issues by customer impact, frequency, and effort to fix. Give each change an owner and a measurement plan. Test fixes on the same tasks used in the baseline. Repeat the review after major catalog, checkout, or policy changes. The value of the benchmark lies in a consistent method and visible improvement over time.
Create scenarios that reflect real buying behavior: a first-time shopper searching by need, a returning customer comparing variants, and a shopper checking delivery or returns before paying. Include an out-of-stock item and a payment failure. Have reviewers complete the tasks without coaching and record where they stop or backtrack. Capture screenshots, device, browser, and the reason for each score so the review can be repeated.
A journey cannot score highly if it works only with a mouse or on a fast desktop connection. Check keyboard use, form labels, contrast, zoom, and clear feedback. Measure loading and interaction on product and checkout pages; an attractive interface that responds late can still lose a purchase. Use the same conditions when comparing later releases.
A simple 0–3 score helps prioritize, but it is not a universal industry ranking. Pair it with actual analytics, support contacts, and qualitative sessions. If checkout exits are high, investigate delivery cost, account requirements, payment availability, and technical failures before redesigning the button. Publish the criteria and limitations whenever the score is shared with stakeholders.
Choose a representative set of products and customer scenarios before scoring. Include a popular item, a low-stock item, a product with variants, and a customer who needs to check returns or delivery terms. Test the same scenarios on the same device classes each time. Reviewers should record the task result, friction observed, supporting screenshot or event, and reason for the score. At least one reviewer should be unfamiliar with the site; a team that built the journey may know workarounds a customer will not.
Use the five journey categories in this brief as separate scores. A total score can help summarize progress, but preserve the category detail. A high product-detail score cannot compensate for an unusable checkout. Mark an item “not assessed” rather than inventing a score when the scenario does not apply.
Analytics can show where customers leave, but not always why. A checkout exit may reflect unexpected delivery cost, a technical error, a payment method gap, or a customer who is still comparing options. Pair event data with session review, support themes, and direct user observation. Segment cautiously: device, market, and customer type may matter, but small groups can produce misleading movements.
Suppose product search returns relevant items but filters reset after a shopper opens a product. Discovery may score 2 because the task is possible with friction. If checkout later hides delivery costs until the final step, that could score 1 even if the payment form itself works. The improvement plan would prioritize preserving search context and showing the full cost earlier. After release, rerun the same tasks and review support questions and checkout behavior.
The scorecard is an internal diagnostic. It is not a cross-retailer ranking or a claim that a score predicts revenue. Reviewers, test devices, product range, and customer expectations affect the result. Use it to compare a store with its own baseline and to make the next change measurable.
In week one, define scenarios and collect baseline analytics. In week two, run task reviews and score evidence. In week three, prioritize the highest-impact issues with product, operations, and support. In week four, release one or two focused fixes and retest the affected journeys. Keep the findings and decision record so the next assessment is comparable.
ABT's 2026 digital delivery outlook covers accountable product ownership, controlled AI pilots, resilient platforms, and a practical planning exercise.
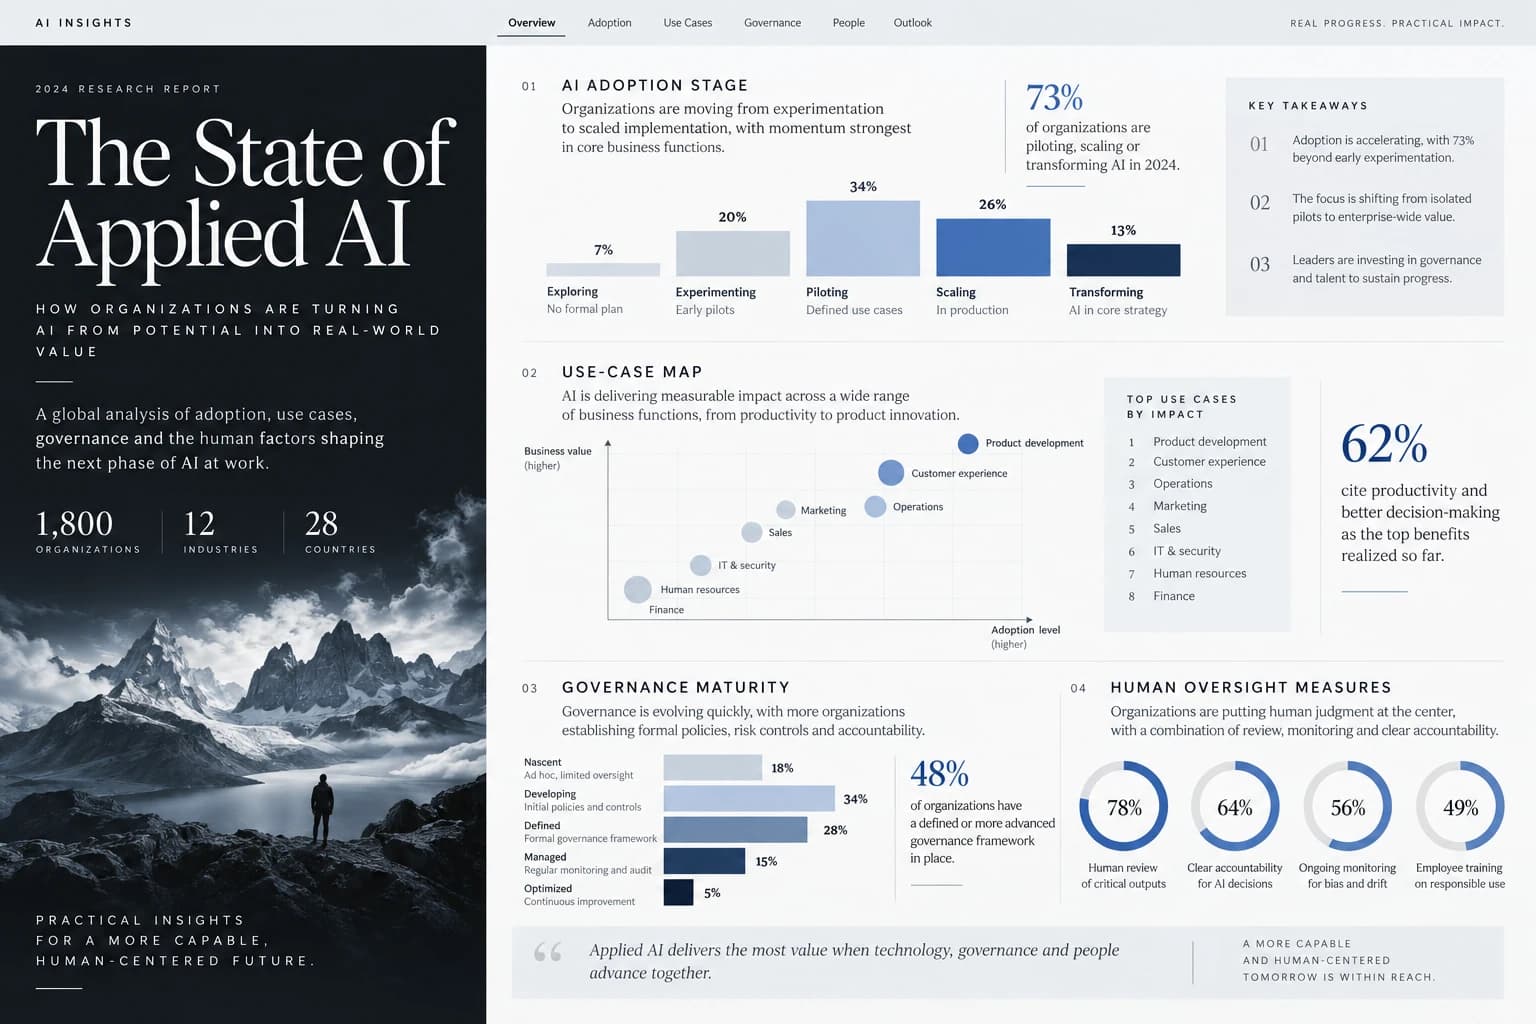
All articles ↗A practical applied AI brief covering use-case selection, evaluation, human review, data boundaries, operating controls, and scale decisions.
All articles ↗Compare retain, improve, replatform, and rebuild options using service continuity, integration risk, data migration, ownership, and measurable outcomes.
All articles ↗